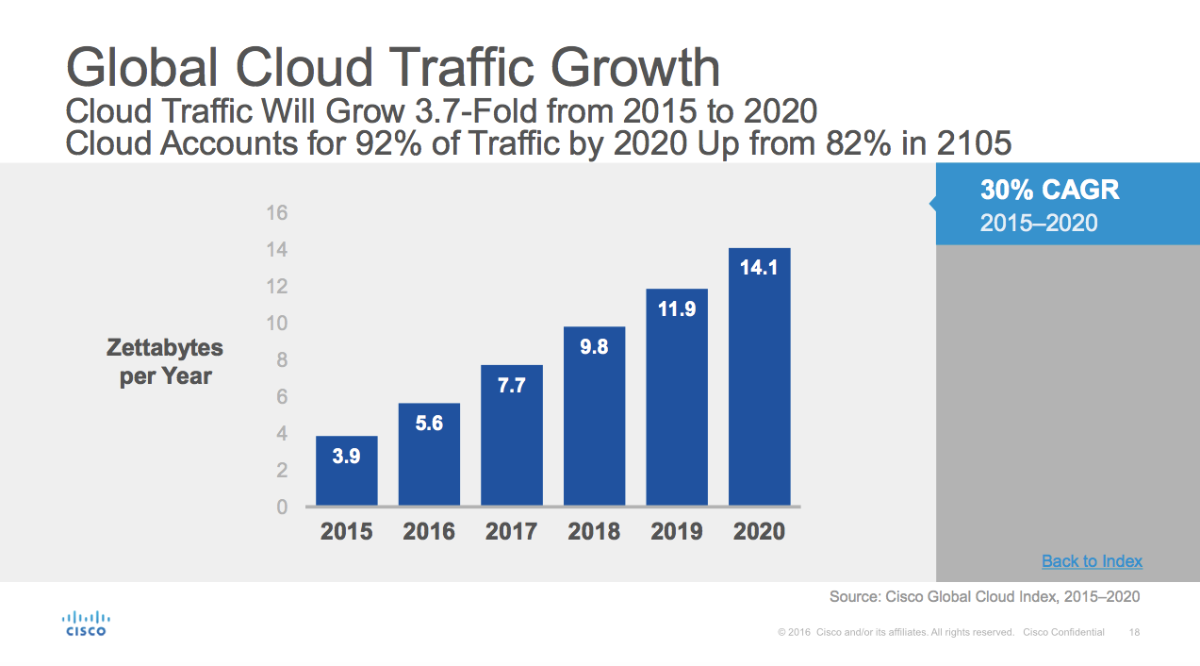
SAN JOSE, Calif. – November 10, 2016 – In today’s unveiling of the sixth annual Cisco® Global Cloud Index (2015-2020), cloud traffic is expected to rise 3.7-fold, up from 3.9 zettabytes (ZB) per year in 2015 to 14.1 ZB per year by 2020. This rapid growth of cloud traffic is attributed to increased migration to cloud architectures due to their ability to scale quickly and efficiently support more workloads than traditional data centers.
With greater data center virtualization, cloud operators are also able to achieve greater operational efficiencies while flexibly delivering a growing variety of services to businesses and consumers with optimal performance. To better understand data center growth, new analysis on application workloads was developed for this year’s report. The following business and consumer projections were revealed:
- Business workloads dominate data center applications and are growing.
- Business workloads will grow by 2.4 fold from 2015 to 2020 but their overall share of data center workloads will decrease from 79 to 72 percent.
- Consumer workloads, while smaller in number, are growing faster. During the same time, consumer workloads will grow faster by 3.5 fold.
- By 2020, consumer workloads will account for 28 percent (134.3 million) of total data center workloads, compared to 21 percent (38.6 million) in 2015.
- IoT/analytics/database workloads are growing the most in terms of share of business workloads with collaboration and compute workloads largely maintaining their share.
- By 2020, database/analytics/Internet of Things (IoT) workloads will account for 22 percent of total business workloads, compared to 20 percent in 2015.
- Video and social networking will lead the increase in consumer workloads, each respectively grows their percentage significantly.
- By 2020: video streaming workloads will account for 34 percent of total consumer workloads, compared to 29 percent in 2015; social networking workloads will account for 24 percent of total consumer workloads, compared to 20 percent in 2015; search workloads will account for 15 percent of total consumer workloads, compared to 17 percent in 2015.
For the first time, Cisco also quantified and analyzed the impact of hyperscale1 data centers. These data centers will grow from 259 in 2015 to 485 by 2020. Hyperscale data center traffic is projected to quintuple over the next five years. These infrastructures will account for 47 percent of total data center installed servers and support 53 percent of all data center traffic by 2020.
A key infrastructure trend is transforming hyperscale (and other) data centers. Software-defined networking (SDN) and network functions virtualization (NFV) are helping to flatten data center architectures and streamline traffic flows. Over the next five years, nearly 60 percent of global hyperscale data centers are expected to deploy SDN/NFV solutions. By 2020, 44 percent of traffic within data centers will be supported by SDN/NFV platforms (up from 23 percent in 2015) as operators strive for greater efficiencies.
“In the six years of this study, cloud computing has advanced from an emerging technology to an essential scalable and flexible part of architecture for service providers of all types around the globe,” said Doug Webster, Vice President of Service Provider Marketing, Cisco. “Powered by video, IoT, SDN/NFV and more, we forecast this significant cloud migration and the increased amount of network traffic generated as a result to continue at a rapid rate as operators streamline infrastructures to help them more profitably deliver IP-based services businesses and consumers alike.”
Additional Global Cloud Index Forecasted Highlights and Projections:
1. With cloud comes networking traffic.
- By 2020, cloud data center traffic will reach 14.1 ZB per year, up from 3.9 ZB per year in 2015. A zettabyte is one trillion gigabytes.
- By 2020, traditional data center traffic will reach 1.3 ZB per year, up from 827 exabytes (EB) per year in 2015.
2. Cloud dominates growth and outpaces traditional data center growth by 2020.
- By 2020, 92 percent of workloads will be processed by cloud data centers; 8 percent will be processed by traditional data centers.
- Workload density (workloads per physical server) for cloud data centers was 7.3 in 2015 and will grow to 11.9 by 2020. Comparatively, for traditional data centers, workload density was 2.2 in 2015 and will grow modestly to 3.5 by 2020.
3. Public cloud is growing faster than private cloud growth.
- By 2020, 68 percent (298 million) of the cloud workloads will be in public cloud data centers, up from 49 percent (66.3 million) in 2015 (35 percent CAGR 2015-2020).
- By 2020, 32 percent (142 million) of the cloud workloads will be in private cloud data centers, down from 51 percent (69.7 million) in 2015 (15 percent CAGR 2015-2020).
4. More consumers will turn to the cloud for storage.
- By 2020, 59 percent (2.3 billion users) of the consumer Internet population will use personal cloud storage up from 47 percent (1.3 billion users) in 2015.
- By 2020, consumer cloud storage traffic per user will be 1.7 GB per month, compared to 513 MB per month in 2015.
5. Data center storage capacity is increasing to accommodate the migration of consumer data from devices to the cloud.
- By 2020, data center storage installed capacity will grow to 1.8 ZB up from 382 EB in 2015, nearly a 5-fold growth.
- By 2020, the total global installed data storage capacity in cloud data centers will account for 88 percent share of total DC storage capacity up from 64.9 percent in 2015.
6. Big data will drive overall growth in stored data.
- Globally, the data stored in data centers will quintuple by 2020 to reach 915 EB by 2020, up 5.3-fold (a CAGR of 40 percent) from 171 EB in 2015.
- Big data will reach 247 EB by 2020, up almost 10-fold from 25 EB in 2015. Big data alone will represent 27 percent of data stored in data centers by 2020, up from 15 percent in 2015.
7. IoT will be a massive data generator.
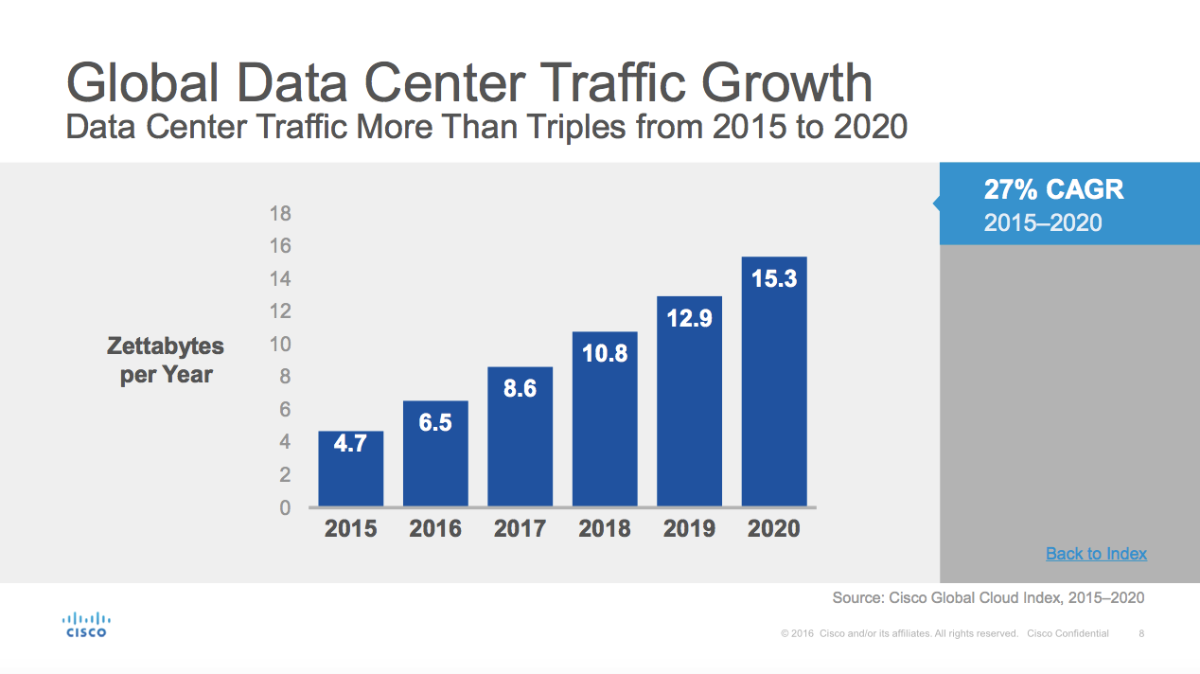
- Globally, data generated (but not necessarily stored) by IoT will reach 600 ZB per year by 2020, 275 times higher than projected traffic going from data centers to end users/devices (2.2 ZB); 39 times higher than total projected data center traffic (15.3 ZB).
8. There is significant opportunity for even more growth as more device data goes online.
- The amount of data stored on devices (5.3 ZB) will be 5 times higher than data stored in data centers by 2020.
9. Improvements in global networks will increase propensity to use cloud applications.
Global Cloud Readiness Advancements (Fixed and Mobile Networks):
- In 2016, 132 countries met the single advanced2 application criteria for fixed networks; up from 119 countries in 2015.
- In 2016, 89 countries met the single advanced application criteria for mobile networks; up from 81 countries in 2015.
Index Overview:
The Cisco® Global Cloud Index (2015-2020) was developed to estimate global data center and cloud-based traffic growth and trends. The report serves as a complementary resource to existing Internet Protocol (IP) network traffic studies such as the Cisco Visual Networking Index™, providing new insights and visibility into emerging trends affecting data centers and cloud architectures. The forecast becomes increasingly important as the network and data center become more intrinsically linked in offering cloud services.
Embedded Infographic:
View our infographic: Growth in the Cloud.
Supporting Resources:
- Visit the Cisco Global Cloud Index webpage.
- Access the Cisco Global Cloud Index, Forecast and Methodology 2015-2020, the Cloud Readiness Supplement and the Q&A and the cloud readiness WP here.
- Explore the Cisco Global Cloud Index Highlights Tool.
- Explore the Cisco Cloud Readiness Tool.
- Register to view the webcast (Americas and Europe time zone), or choose Asia Pacific time zone option.
- Follow us on Twitter: @CiscoSP360 and through the hashtag #CiscoGCI
- Connect with us on Facebook: Cisco SP360
Editor’s Note:
Cisco welcomes analysts, bloggers, media, regulators, service providers and other interested parties to use Cisco’s research with proper attribution: “Source: Cisco Global Cloud Index.”
Cisco (NASDAQ: CSCO) is the worldwide technology leader that has been making the Internet work since 1984. Our people, products, and partners help society securely connect and seize tomorrow's digital opportunity today. Discover more at newsroom.cisco.com and follow us on Twitter at @Cisco.
# # #
Cisco and the Cisco logo are trademarks or registered trademarks of Cisco and/or its affiliates in the U.S. and other countries. A listing of Cisco's trademarks can be found at www.cisco.com/go/trademarks. Third-party trademarks mentioned are the property of their respective owners. The use of the word partner does not imply a partnership relationship between Cisco and any other company.
1Synergy (a syndicated research source for the Cisco GCI Forecast) has identified 24 hyperscale operators. To be a hyperscale cloud operator, a company must meet the following infrastructure-as-a-service (IaaS), platform-as-a-service (PaaS), software-as-a-service (SaaS) or other cloud service revenues requirements:
- $1B in IaaS/PaaS
- $2B in SaaS
- $4B in Internet/ Search/Social Networking
- $8B in e-commerce/ payment processing
2Basic Cloud Apps: Network Requirements—Download Speed: Up to 750 kbps; Upload Speed: Up to 250 kbps; Latency: Above 160 ms
Intermediate Cloud Apps: Network Requirements—Download Speed: 751–2,500 kbps; Upload Speed: 251–1,000 kbps; Latency: 159–100 ms
Advanced Cloud Apps: Network Requirements—Download Speed: >2,500 kbps; Upload Speed: Higher than 1,000 kbps; Latency: <100 ms


