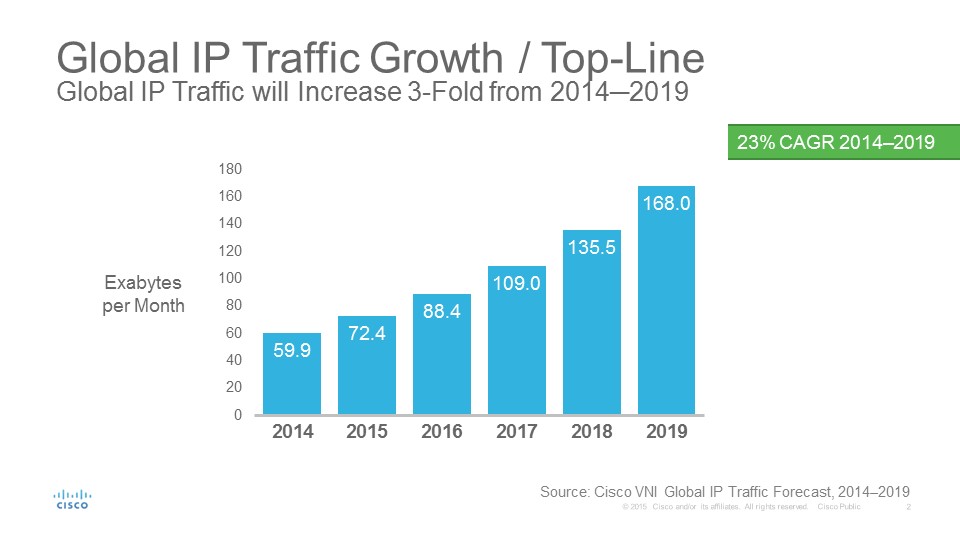
SAN JOSE, Calif. – May 27, 2015 – According to the 10th annual Cisco® Visual Networking Index™ (VNI) Forecast, annual Internet Protocol (IP) traffic will triple between 2014 and 2019, when it will reach a record 2 zettabytes. Factors expected to drive traffic growth include global increases in Internet users, personal devices and machine-to-machine (M2M) connections, faster broadband speeds, and the adoption of advanced video services. Collectively, these variables are expected to create a global IP traffic compound annual growth rate (CAGR) of 23 percent – the first global CAGR increase in consecutive VNI forecasts in nearly a decade (e.g., last year’s projected CAGR for 2013 – 2018 was 21 percent).
Key Global IP Traffic and Service Predictions
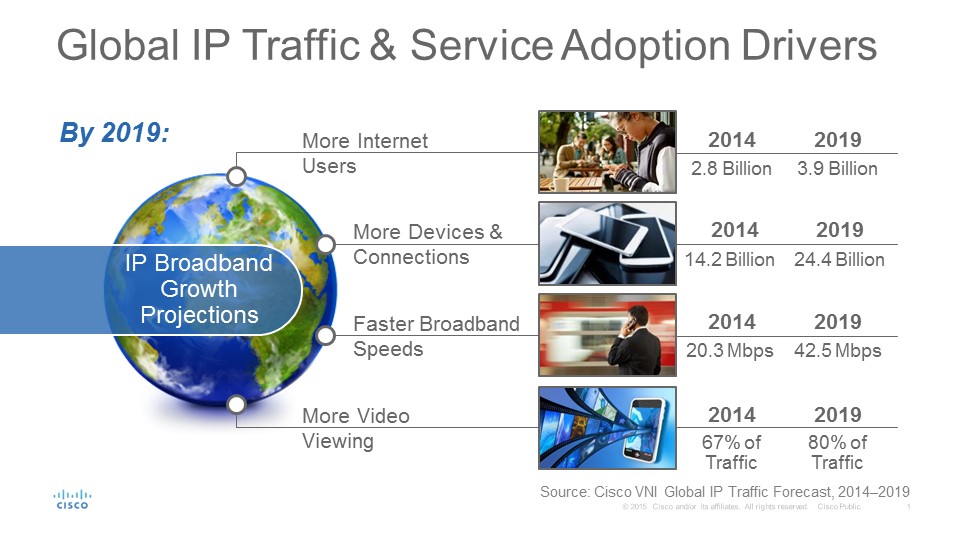
Cisco predicts that global IP traffic will reach 168 exabytes per month by 2019, up from 59.9 exabytes per month in 2014. In 2019, nearly as much traffic will traverse global IP networks than all prior “Internet years” combined (from 1984 to the end of 2013). Several elements will shape IP traffic in the coming years:
- More Internet Users – As fixed and mobile networks grow and expand, more people will have network and Internet access. In 2014, there were 2.8 billion Internet users, or 39 percent of the world’s population of 7.2 billion. By 2019, there will be about 3.9 billion Internet users, or 51 percent of the world’s projected population of 7.6 billion (Source: Population Division of the Dept. of Economic & Social Affairs of the United Nations).
- Proliferation of Devices and Connections – With 24 billion networked devices/connections expected online by 2019, compared with 14 billion in 2014, service provider networks must adapt to an influx of sophisticated devices. These devices include tablets, smartphones, and Internet-enabled ultra-high definition (UHD) TVs, as well as M2M connections and wearables (including new smart watches, health monitors, etc.). Globally, there will be 3.2 networked devices/connections per capita by 2019, up from 2 per capita in 2014. These advanced devices and connections will need to be authenticated to gain access to fixed and mobile networks, which require enhanced intelligence, network management and security. A comprehensive IPv6 strategy will be imperative for carriers to accommodate the volume and complexity of next-generation devices and connections. Globally, 41 percent of all fixed and mobile networked devices/connections will be IPv6-capable by 2019, up from 22 percent in 2014.
- Faster Fixed Broadband Speeds – Globally, the average fixed broadband speed will increase two-fold from 20.3 Mbps in 2014 to 42.5 Mbps in 2019. Year-over-year, the average global fixed broadband speed grew 26 percent from 16 Mbps in 2013 to 20.3 Mbps in 2014. From a regional perspective, Western Europe and Asia Pacific continue to lead the world in fixed broadband network speeds. North America and other regions are also updating their network resources to accommodate more bandwidth-intensive content and applications (e.g., UHD video). By 2019, 33 percent of all global fixed broadband connections will be faster than 25 Mbps, up from 29 percent today (mobile network speeds are covered in the February 2015 VNI Mobile report).
- New and Advanced Video Services – IP video will account for 80 percent of all IP traffic by 2019, up from 67 percent in 2014. The evolution of advanced video services (e.g., UHD and spherical/360 video) and increasingly video centric M2M applications are anticipated to create new bandwidth and scalability requirements for service providers. Residential, business and mobile consumers continue to have strong demand for advanced video services across all network and device types, making quality, convenience, content/experience and price key success factors.
- Mobility Momentum – By 2019, more than 14 percent of monthly IP traffic will derive from cellular connections, and 53 percent of monthly IP traffic will come from Wi-Fi connections globally, making differentiated and monetizable mobile strategies more important for all service providers.
- Wi-Fi and mobile connected devices will generate 67 percent of IP traffic by 2019 – Wi-Fi: 53 percent and cellular: 14 percent – compared with fixed traffic, which will account for 33 percent of overall traffic.
- In 2014, fixed traffic accounted for 54 percent of IP traffic, while Wi-Fi accounted for 42 percent and cellular 4 percent.
- The Internet of Everything (IoE) and M2M Growth – The IoE trend is showing tangible growth as M2M connections will more than triple over the next five years (growing to 10.5 billion by 2019). There will be significant IoE adoption across many business verticals (e.g., agriculture, healthcare, manufacturing, retail, and transportation) as well as connected home deployments (i.e., video security, smart meters, lighting/temperature control, etc.).
- Connected Health consumer segment will represent the fastest M2M connections growth at 8.6-fold (54 percent CAGR) from 2014 to 2019;
- Connected home segment will represent nearly half (48 percent) of M2M connections by 2019.
- Annual global M2M IP traffic will grow 15-fold over this same period—from 308 petabytes in 2014 (0.5 percent of global IP traffic) to 4.6 exabytes by 2019 (2.7 percent of global IP traffic).
- Gaming Impact – Cisco predicts a marked increase in network traffic associated with game downloads driven by availability of storage capacity on gaming consoles, an increase in upstream cloud traffic, and increasing fiber connections.
- Advanced Service Adoption – Online music will be the fastest-growing residential Internet service with a CAGR of 7.7 percent from 2014-2019, growing from 1.2 billion users to 1.7 billion users by 2019. Mobile location-based service (LBS) will be the fastest growing consumer mobile service with a CAGR of 27.5 percent from 2014-19, growing from 597 million users in 2014 to over 2 billion users by 2019. Desktop and personal videoconferencing will be the fastest growing business Internet service with a CAGR of 23.5 percent from 2014-2019, growing from 76 million users in 2014 to 220 million users by 2019.
Regional & Country IP Traffic Projections
- APAC: 54.4 exabytes/month by 2019, 21 percent CAGR, 2.6-fold growth
- North America: 49.7 exabytes/month by 2019, 20 percent CAGR, 2.5-fold growth
- Western Europe: 24.7 exabytes/month 2019, 21 percent CAGR, 2.6-fold growth
- Central Europe: 16.9 exabytes/month by 2019, 33 percent CAGR, 4.1-fold growth
- Latin America: 12.9 exabytes/month by 2019, 25 percent CAGR, 3-fold growth
- Middle East and Africa: 9.4 exabytes/month by 2019, 44 percent CAGR, 6.3-fold growth
- By 2019, the highest traffic-generating countries will be the U.S. (45.7 exabytes/month) and China (21.9 exabytes/month).
- South Africa and Saudi Arabia will have the highest IP traffic growth rate with a 44 percent CAGR from 2014 to 2019. Following will be Indonesia (36 percent CAGR) and India (33 percent CAGR) over the forecast period.
Global VNI Traffic Breakdowns by Application Type
Global IP Video Traffic
- 134.8 exabytes per month in 2019, 27 percent CAGR from 2014 to 2019.
- IP video traffic will grow 3-fold from 2014 to 2019.
- Consumer IP video traffic will be 84 percent of consumer IP traffic by 2019, up from 75 percent in 2014.
- Business IP video traffic will be 63 percent of business IP traffic by 2019, up from 36 percent in 2014.
Global Internet Video Traffic
- 105 exabytes per month in 2019, 33 percent CAGR from 2014 to 2019.
- Internet video traffic will grow 4-fold from 2014 to 2019.
- Internet video traffic will reach 105 exabytes per month by 2019, up from 25 exabytes per month in 2014.
- Internet video traffic (business and consumer) will be 77 percent of all Internet traffic in 2019, up from 59 percent in 2014.
- Consumer Internet video traffic will be 80 percent of consumer Internet traffic by 2019, up from 64 percent in 2014.
- Business Internet video traffic will be 65 percent of business Internet traffic by 2019, up from 38 percent in 2014.
HD and Ultra HD (4K) Internet Video Traffic
- 66 exabytes per month in 2019, 53 percent CAGR from 2014 to 2019.
- By 2019, HD and ultra HD Internet video will make up 63 percent of Internet video traffic.
- Advanced Internet video (HD and ultra HD) will increase 8.5-fold between 2014 and 2019.
- Installed/In-service 4K TV sets will increase from 9.9M in 2014 to 371.5M by 2019 (2.7 percent of flat panel TVs in 2014; 31 percent of flat panel TVs by 2019 --106 percent CAGR)
Global Consumer VoD Traffic
- 26.8 exabytes per month by 2019, 14 percent CAGR from 2014 to 2019.
- VoD traffic will increase nearly 2-fold between 2014 and 2019.
Global Business IP Traffic
- 29.9 exabytes per month by 2019, 20 percent CAGR from 2014 to 2019.
- Overall business IP traffic, which includes web, backup, VoIP, etc., will double between 2014 and 2019.
- In 2014, business IP traffic represented 20 percent of monthly total global IP traffic (consumer was 80 percent).
- By 2019, business IP traffic will represent 18 percent of monthly total global IP traffic (consumer will be 82 percent).
Global VNI Traffic Breakdowns by Access Type
Global Fixed/Wired Traffic
- 55.7 exabytes per month by 2019, 11 percent CAGR from 2014 to 2019.
- By 2019, global fixed IP traffic will reach 670.5 exabytes annually and will grow 2X from 2014 to 2019.
- In 2014, fixed IP traffic represented 54 percent of monthly total global IP traffic.
- By 2019, fixed IP traffic will represent nearly 33 percent of monthly total global IP traffic.
Global Fixed/Wi-Fi Traffic
- 88.1 exabytes per month by 2019, 29 percent CAGR from 2014 to 2019.
- By 2019, global fixed/Wi-Fi traffic will reach 1.1 zettabytes annually and will grow 4X from 2014 to 2019.
- In 2014, fixed/Wi-Fi traffic represented 42 percent of monthly total global IP traffic.
- By 2019, fixed/Wi-Fi traffic will represent nearly 53 percent of monthly total global IP traffic.
Global Mobile Data Traffic
- 24.3 exabytes per month by 2019, 57 percent CAGR from 2014 to 2019
- By 2019, global mobile data traffic 291.8 exabytes annually and will grow 10X from 2014 to 2019.
- In 2014, mobile data traffic represented 4 percent of monthly total global IP traffic.
- By 2019, mobile data traffic will represent nearly 14 percent of monthly total global IP traffic.
Cisco® VNI Forecast Implications for Service Providers
- Due to the increasing number of devices (e.g., tablets, smartphones and M2M connections) that will need to be authenticated to gain access to fixed/mobile networks (enhanced security and intelligence required), increased bandwidth capacity is not the only requirement in the next half decade.
- The evolution of advanced video services (e.g., HD/ultra HD video, spherical video) and M2M applications are expected to create new bandwidth and scalability requirements for SPs. Residential, business and mobile consumers continue to have strong demand for advanced video services across all network and device types (quality, convenience, and price are key factors for success).
- Continued business video adoption (i.e., HD and web-based video conferencing and business VoD) may prompt greater growth in network virtualization and leveraging the Internet for video transmission (network ramifications for SPs/OTTPs).
- By 2019, more than 14% of monthly global IP traffic will come from cellular connections and 53% of monthly IP traffic will come from Wi-Fi connections (i.e., more than two-thirds or 67% of total monthly IP traffic). Differentiated and monetizable mobile strategies will be important for all SPs.
- IP networks must be intelligent and flexible enough to support the constant introduction of new/updated applications for fixed and mobile networks. Many SPs are actively collaborating with application and content developers to differentiate their services.
Cisco VNI Methodology
The Cisco VNI Global Forecast and Service Adoption study for 2014 to 2019 rely upon independent analyst forecasts and real-world mobile data usage studies. Upon this foundation are layered Cisco's own estimates for global IP traffic and service adoption. A detailed methodology description is included in the complete report. Over its 10-year history, Cisco VNI research has become a highly regarded measure of the Internet's growth. National governments, network regulators, academic researchers, telecommunications companies, technology experts and industry/business press and analysts rely on the annual study to help plan for the digital future.
Supporting Quote
- Doug Webster, Vice President of Service Provider Products and Solutions Marketing, Cisco
“It took 32 years – from 1984 to 2016 – to generate the first zettabyte of IP traffic annually. However, as this year’s Visual Networking Index forecasts, it will take only three additional years to reach the next zettabyte milestone when there will be more than 2 zettabytes of IP Traffic annually by 2019. As consumers, businesses and societies alike head towards the Digital Era with the Internet of Everything gaining momentum, VNI is even more relevant now in its 10th year than it was in its first. For our customers and the industry ecosystem as whole, we look forward to continuing to report on these trends, the challenges they bring, and the immense opportunities ahead.”
Cisco VNI Global Traffic Forecast Update Webcast
Cisco invites press, analysts and bloggers to attend a webcast featuring Cisco executives reviewing the global impact of traffic growth for service providers, organizations and consumers. The pre-recorded webcast begins at 9:00 a.m. (PDT) today and can be accessed by registering at Cisco VNI Complete IP Traffic Forecast Update (2014-2019).
Supporting Images
- Cisco VNI: Global IP Traffic Drivers
- Cisco VNI: Global Complete (Fixed & Mobile) IP Traffic Growth 2014 - 2019
- Infographic: “VNI Forecast Update, 2014-2019”
Additional Supporting Resources
- Cisco Visual Networking Index homepage and VNI Service Adoption Forecast site
- Cisco VNI blog post: “2015 Cisco VNI Complete Forecast Update: Key Trends Include Mobility, M2M, and Multimedia Content”
- Read the complete Cisco VNI Complete IP Traffic Forecast Update, 2014–2019 white paper.
- Read the Zettabyte Era Trends and Analysis white paper
- Follow Cisco’s VNI news and activities on Twitter: #VNI and @CiscoVNI.
- Follow us on our LinkedIn page for targeted updates and announcements
- For more information about Cisco’s service provider news and activities visit the SP360 Blog
- Cisco Service Provider Mobility Community
- Subscribe to Cisco's SP360 feed
- For new services opportunities & revenue forecast, Visit #CiscoMOI to see the forecast
Editor’s Notes
Cisco also welcomes press, analysts, bloggers, service providers, regulators and other interested parties to use and reference our research with proper attribution, such as “Source: Cisco Visual Networking Index Global Traffic Forecast Update, 2014-2019.”
Cisco defines the following terms:
- Cellular Traffic: comes from a cellular or radio network connection—2G, 3G and 4G.
- Wi-Fi Offload Traffic: refers to traffic from dual mode devices (supports cell and Wi-Fi connectivity; excluding laptops) over Wi-Fi/small cell networks. Offloading occurs at the user/device level when one switches from a cellular connection to Wi-Fi/small cell access.
- Fixed/Wi-Fi Traffic: comes from a wireless connection enabled by some fixed network source, such as a residential Wi-Fi router or public hotspot.
Tags/Keywords
Cisco, Service Provider, Visual Networking Index, VNI, IP Traffic, Mobile Data, Video, Complete VNI Forecast, Doug Webster, Internet of Everything, IoE, M2M, Machine-to-Machine
RSS Feed for Cisco: http://newsroom.cisco.com/dlls/rss.html
About Cisco
Cisco (NASDAQ: CSCO) is the worldwide leader in IT that helps companies seize the opportunities of tomorrow by proving that amazing things can happen when you connect the previously unconnected. For ongoing news, please go to http://newsroom.cisco.com.
# # #
Cisco and the Cisco logo are trademarks or registered trademarks of Cisco and/or its affiliates in the U.S. and other countries. A listing of Cisco's trademarks can be found at www.cisco.com/go/trademarks. Third-party trademarks mentioned are the property of their respective owners. The use of the word partner does not imply a partnership relationship between Cisco and any other company.