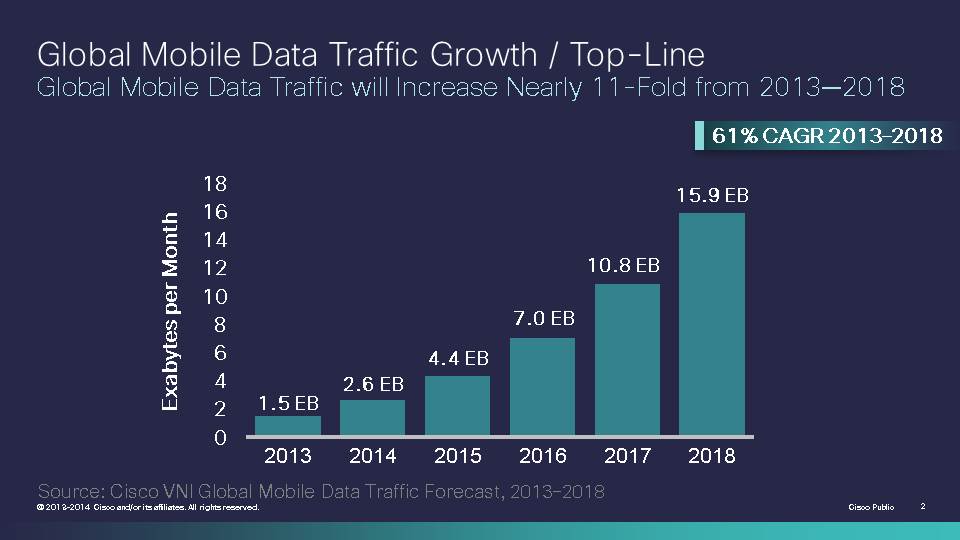
SAN JOSE, Calif. – Feb. 5, 2014 – According to the Cisco® Visual Networking Index™ Global Mobile Data Traffic Forecast for 2013 to 2018, worldwide mobile data traffic will increase nearly 11-fold over the next four years and reach an annual run rate of 190 exabytes by 2018. The projected increase in mobile traffic is partly due to continued strong growth in the number of mobile Internet connections, such as personal devices and machine-to-machine (M2M) connections, which will exceed 10 billion by 2018 and be 1.4 times greater than the world’s population (the United Nations estimates 7.6 billion people by 2018).
*An exabyte is a unit of information or computer storage equal to one quintillion bytes or one billion gigabytes.
The Cisco VNI Global Mobile Data Traffic Forecast’s annual run rate of 190 exabytes of mobile data traffic for 2018 is equivalent to:
- 190 times more than all Internet Protocol (IP) traffic, fixed and mobile, generated in 2000; or
- 42 trillion images (e.g., multimedia message service or Instagram)—15 daily images per person on earth for a year; or
- 4 trillion video clips (e.g., YouTube)—more than one daily video clip per person on earth for a year.
The incremental amount of traffic being added to the mobile Internet just between 2017 and 2018 is 5.1 exabytes per month, which is more than three times the estimated size of the entire mobile Internet in 2013 (1.5 exabytes per month).
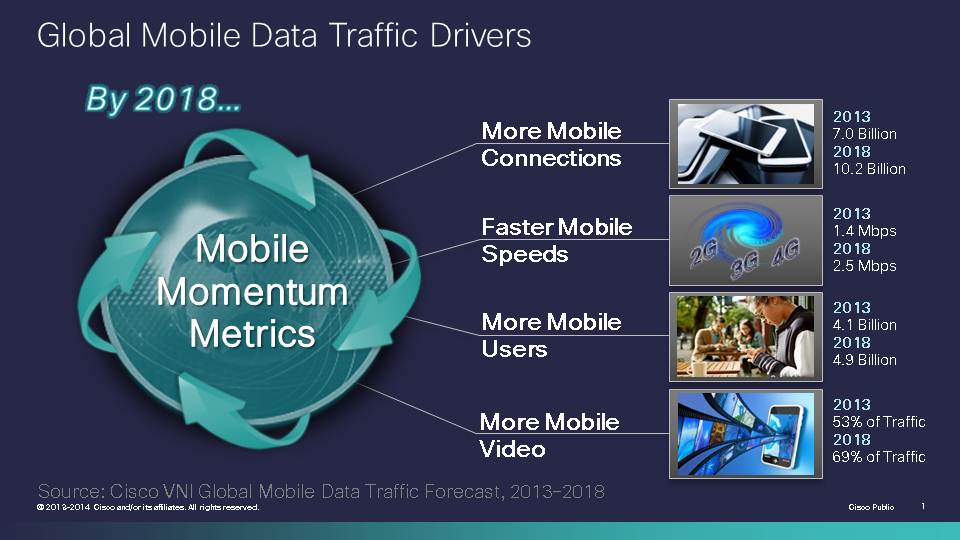
Key Global Mobile Data Traffic Drivers
From 2013 to 2018, Cisco anticipates that global mobile traffic growth will outpace global fixed traffic growth by a factor of three. The following trends are driving mobile data traffic growth:
- More mobile users: By 2018, there will be 4.9 billion mobile users, up from 4.1 billion in 2013.
- More mobile connections: By 2018, there will be more than 10 billion mobile-ready devices/connections—including eight billion personal mobile devices and two billion M2M connections, up from seven billion total mobile-ready devices and M2M connections in 2013.
- Faster mobile speeds: Average global mobile network speeds will nearly double from 1.4 Mbps in 2013 to 2.5 Mbps by 2018.
- More mobile video: By 2018, mobile video will represent 69 percent of global mobile data traffic, up from 53 percent in 2013.
Global Shift to Smarter Devices
- Globally, 54 percent of mobile connections will be “smart” connections by 2018, up from 21 percent in 2013. Smart devices and connections have advanced computing/multi-media capabilities and a minimum of 3G connectivity.
- Smartphones, laptops, and tablets will drive about 94 percent of global mobile data traffic by 2018. M2M traffic will represent five percent of 2018 global mobile data traffic while basic handsets will account for 1 percent of global mobile data traffic by 2018. Other portables will account for 0.1 percent.
- Mobile cloud traffic will grow 12-fold from 2013 to 2018, a 64 percent compound annual growth rate (CAGR).
Impact of Machine-to-Machine Connections (and Wearable Devices)
M2M refers to applications that enable wireless and wired systems to communicate with similar devices to support global positioning satellite (GPS) navigation systems, asset tracking, utility meters, security and surveillance video. A new “wearable devices” sub-segment has been added to the M2M connections category to help project the growth trajectory of the Internet of Everything (IoE). Wearable devices include things that are worn by people such as smart watches, smart glasses, health and fitness trackers, wearable scanners with capability to connect and communicate to the network either directly via embedded cellular connectivity or through another device such as a smartphone via Wi-Fi and Bluetooth.
- In 2013, M2M connections represented nearly five percent of mobile-connected devices in use and generated more than one percent of total mobile data traffic
- By 2018, M2M connections will represent nearly 20 percent of mobile-connected devices in use and generate almost six percent of total mobile data traffic.
- In 2013, there were 21.7 million global wearable devices. By 2018, there will be 176.9 million global wearable devices or a 52 percent CAGR.
Impact of Faster Global Mobile Network Connection Speeds
The average mobile connection is expected to nearly double from 2013 to 2018. Mobile connection speeds are a key factor in supporting/accommodating mobile data traffic growth.
| (Kbps) |
2012 |
2013 |
2014 |
2015 |
2016 |
2017 |
CAGR |
| Average Mobile |
1,387 |
1,676 |
1,908 |
2,147 |
2,396 |
2,509 |
13 % |
| Average Smartphone |
3,983 |
4,864 |
5,504 |
6,132 |
6,756 |
7,044 |
12 % |
Source: Results from Cisco Global Internet Speed Test (GIST) (part of the Cisco VNI program) and other independent speed tests. The Cisco GIST application has more than one million global users. These projections include cellular connection speeds only (not Wi-Fi) and are based on extrapolations from historical mobile network connection speed data.
4G Mobile Adoption and Traffic Growth
Many global service providers are deploying 4G technologies to address consumer and business users’ strong demand for wireless services and content. In many emerging markets, service providers are creating new mobile infrastructures with 4G solutions. In some mature markets, service providers are supplementing or replacing legacy 2G or 3G solutions with 4G technologies.
- By 2018, 4G connections will support 15 percent of all connections, up from 2.9 percent in 2013.
- By 2018, 4G connections will support 51 percent, or 8 exabytes per month, of total mobile data traffic, up from 30 percent, or 448 petabytes per month, in 2013.
- 4G traffic will grow 18-fold from 2013 to 2018, a 78 percent CAGR.
Wi-Fi Offload Traffic Surpasses Cellular Traffic
“Offload” refers to traffic from dual mode devices and supports cell and Wi-Fi connectivity, excluding laptops) over Wi-Fi and small cell networks. Offloading occurs at the user or device level when one switches from a cell connection to Wi-Fi and small cell access. The Cisco VNI Global Mobile Data Traffic Forecast (2013-2018) mobile offload projections include traffic from public hotspots and residential Wi-Fi networks.
- More mobile data traffic will be offloaded onto Wi-Fi from mobile-connected devices (17.3 exabytes per month) than will remain on mobile networks by 2018 (15.9 exabytes per month).
- By 2018, 52 percent of global mobile traffic will be offloaded onto Wi-Fi/small cell networks, up from 45 percent in 2013.
Global Mobile Application Analysis: Video Remains on Top
Mobile video traffic will increase 14-fold from 2013 to 2018 and will have the highest growth rate of any mobile application category.
- By 2018, mobile video will be 69 percent of global mobile traffic, up from 53 percent in 2013.
- By 2018, web and other data applications will be 17 percent of global mobile traffic, down from 28 percent in 2013.
- By 2018, streaming audio will be 11 percent of global mobile traffic, down from 14 percent in 2013.
- By 2018, file sharing will be three percent of global mobile traffic, down from four percent in 2013.
Key Regional Growth Projections
In terms of mobile data traffic growth rates over the forecast period, the Middle East and Africa region is projected to have the highest regional growth rate. Below is how each of the regions ranks in terms of growth rate by 2018:
1. The Middle East and Africa will have a 70 percent CAGR and 14-fold growth;
2. Central and Eastern Europe will have a 68 percent CAGR and 13-fold growth;
3. Asia-Pacific will have a 67 percent CAGR and 13-fold growth;
4. Latin America will have a 66 percent CAGR and 13-fold growth;
5. North America will have a 50 percent CAGR and eight-fold growth; and
6. Western Europe will have a 50 percent CAGR and seven-fold growth.
In terms of mobile data traffic generation, the Asia-Pacific region is projected to generate the most mobile data traffic. Below is how each of the regions ranks in terms of anticipated mobile data traffic generation by 2018:
- Asia-Pacific: 6.72 exabytes per month;
- North America: 2.95 exabytes per month;
- Western Europe: 1.9 exabytes per month;
- Central and Eastern Europe: 1.64 exabytes per month;
- The Middle East and Africa: 1.49 exabytes per month; and
- Latin America: 1.16 exabytes per month.
Cisco Mobile VNI Forecast Methodology
The Cisco VNI Global Mobile Data Traffic Forecast (2013-2018) relies upon independent analyst forecasts and real-world mobile data usage studies. Upon this foundation are layered Cisco’s own estimates for mobile application adoption, minutes of use, and transmission speeds. Key enablers such as mobile broadband speed and device computing power are also factored into Cisco mobile VNI projections and findings. A detailed methodology description is included in the complete report (see link below).
Supporting Quote
- Doug Webster, Vice President of Products and Solutions Marketing, Cisco
“Global mobile data traffic will continue its truly remarkable growth, increasing nearly 11-fold over the next five years, to reach an amount in 2018 that is more than 57 times the total amount of mobile data traffic just a few years ago in 2010. Such growth is not only indicative of mobility becoming a critical characteristic of almost every network experience and the value consumers and businesses alike place on it, but it also represents the immense opportunities ahead for service providers who sit at the center of the Internet of Everything.”
Photo and Video
- Doug Webster, Vice President of Products and Solutions Marketing, Cisco
- Cisco Visual Networking Index Global Mobile Data Traffic Forecast Update (2013-2018) Overview
Images
- Global Mobile Data Traffic Drivers
- Global Mobile Data Traffic Growth — Top Line
- Cisco Visual Networking Index Global Mobile Data Traffic Forecast
Additional Supporting Resources
- Cisco Visual Networking Index home-page
- Cisco Visual Networking Index Mobile Data Traffic blog post: “Cisco VNI Global Mobile Data Traffic Forecast Update (2013-2018)”
- To access b-roll, visit the Cisco Online Press Room and follow username and password instructions (Folder Name: PR; File Name: Cisco Visual Networking Index Global Mobile Data Traffic Forecast, February 2013).
- Read the complete Cisco Visual Networking Index Mobile Data Traffic Forecast and Methodology, 2013-2018 white paper.
- Cisco Visual Networking Index Mobile Data Traffic Forecast, 2013-2018 FAQs
- Learn more about the free Cisco Visual Networking Index resources
- See the latest Cisco GIST results worldwide: http://gistdata.ciscovni.com/
- Follow us on our LinkedIn page for targeted updates and announcements
- For more information about Cisco’s service provider news and activities visit the SP360 Blog or follow us on Twitter @CiscoVNI.
- Cisco Service Provider SlideShare presentations
- Cisco Service Provider Mobility Community
- Subscribe to Cisco's SP360 feed
Cisco VNI Global Mobile Data Traffic Forecast Update Webcast
Cisco invites press, analysts and bloggers to attend a webcast featuring Cisco executives talking about the global impact of mobile data traffic growth for service providers, organizations and consumers. The pre-recorded webcast begins at 8:00 a.m. (PST) today and can be accessed by registering at Cisco VNI Global Mobile Data Traffic Forecast Update (2013-2018).
Editor’s Notes
Cisco also welcomes press, analysts, bloggers, service providers, regulators and other interested parties to use and reference our research with proper attribution, such as “Source: Cisco Visual Networking Index Global Mobile Data Traffic Forecast Update, 2013-2018.”
Cisco defines the following terms:
- Cellular Traffic: comes from a cellular or radio network connection—2G, 3G and 4G.
- Wi-Fi Offload Traffic: refers to traffic from dual mode devices (supports cell and Wi-Fi connectivity; excluding laptops) over Wi-Fi/small cell networks. Offloading occurs at the user/device level when one switches from a cellular connection to Wi-Fi/small cell access.
- Fixed/Wi-Fi Traffic: comes from a wireless connection enabled by some fixed network source, such as a residential Wi-Fi router or public hotspot.
Tags/Keywords
Cisco, Service Provider, Visual Networking Index, VNI, Mobile Internet, Mobile Data, Mobile Video, Mobile VNI, Doug Webster
RSS Feed for Cisco: http://newsroom.cisco.com/dlls/rss.html
About Cisco
Cisco (NASDAQ: CSCO) is the worldwide leader in IT that helps companies seize the opportunities of tomorrow by proving that amazing things can happen when you connect the previously unconnected. For ongoing news, please go to http://thenetwork.cisco.com.
# # #
Cisco and the Cisco logo are trademarks or registered trademarks of Cisco and/or its affiliates in the U.S. and other countries. A listing of Cisco's trademarks can be found at www.cisco.com/go/trademarks. Third-party trademarks mentioned are the property of their respective owners. The use of the word partner does not imply a partnership relationship between Cisco and any other company.